pab data visualisation
mountain visualisation, part II
Please find the introduction in part I. The following explains some add-ons in 2011.
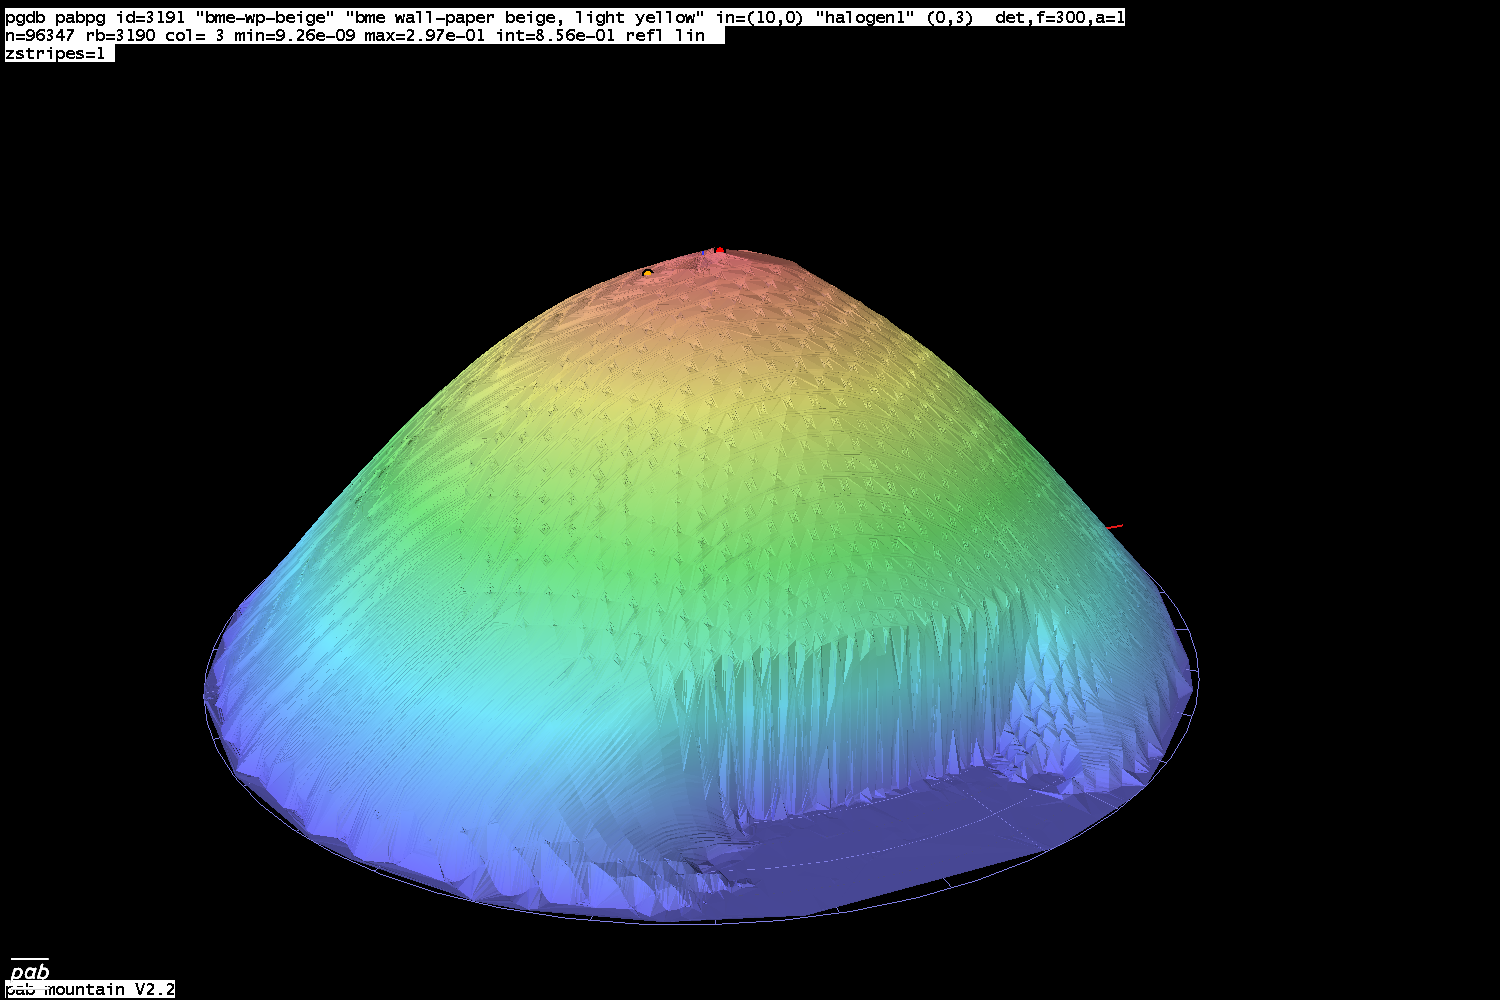
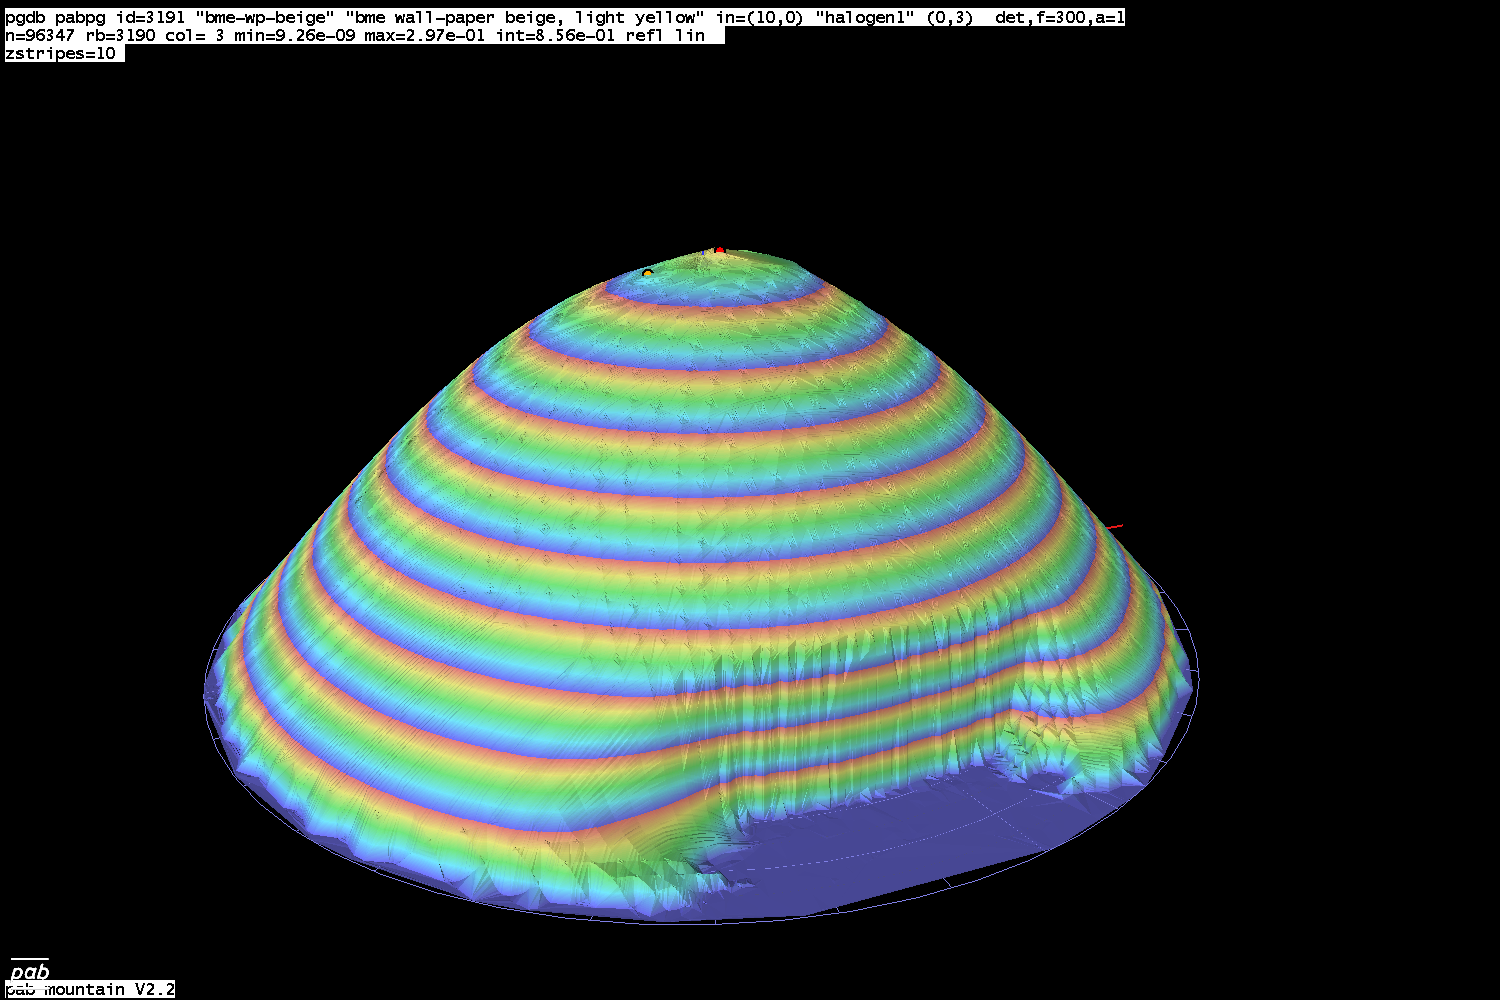
- -zstripes N
- Option sets number of vertical stripes: For N=1 (the default), the color/frayscale is mapped from minimum to the
maximum value. For N>1 the colormap is cycled N-times between these two points. This leads to vertical stripes that offer greater
visual resolution of peak shapes and slowly varying areas. Example: Setting N=10, the first blue colorband below maximum is at 90% of
maximum
N is added to the on-screen text lines if N>1 .
- -zref v
- Option sets the zero-reference plane: Above zref (default 0), the surface is colored, values below are displayed with
a greyscale map.
| zref=0 (default)
| zref=0.1
|
|
|
|
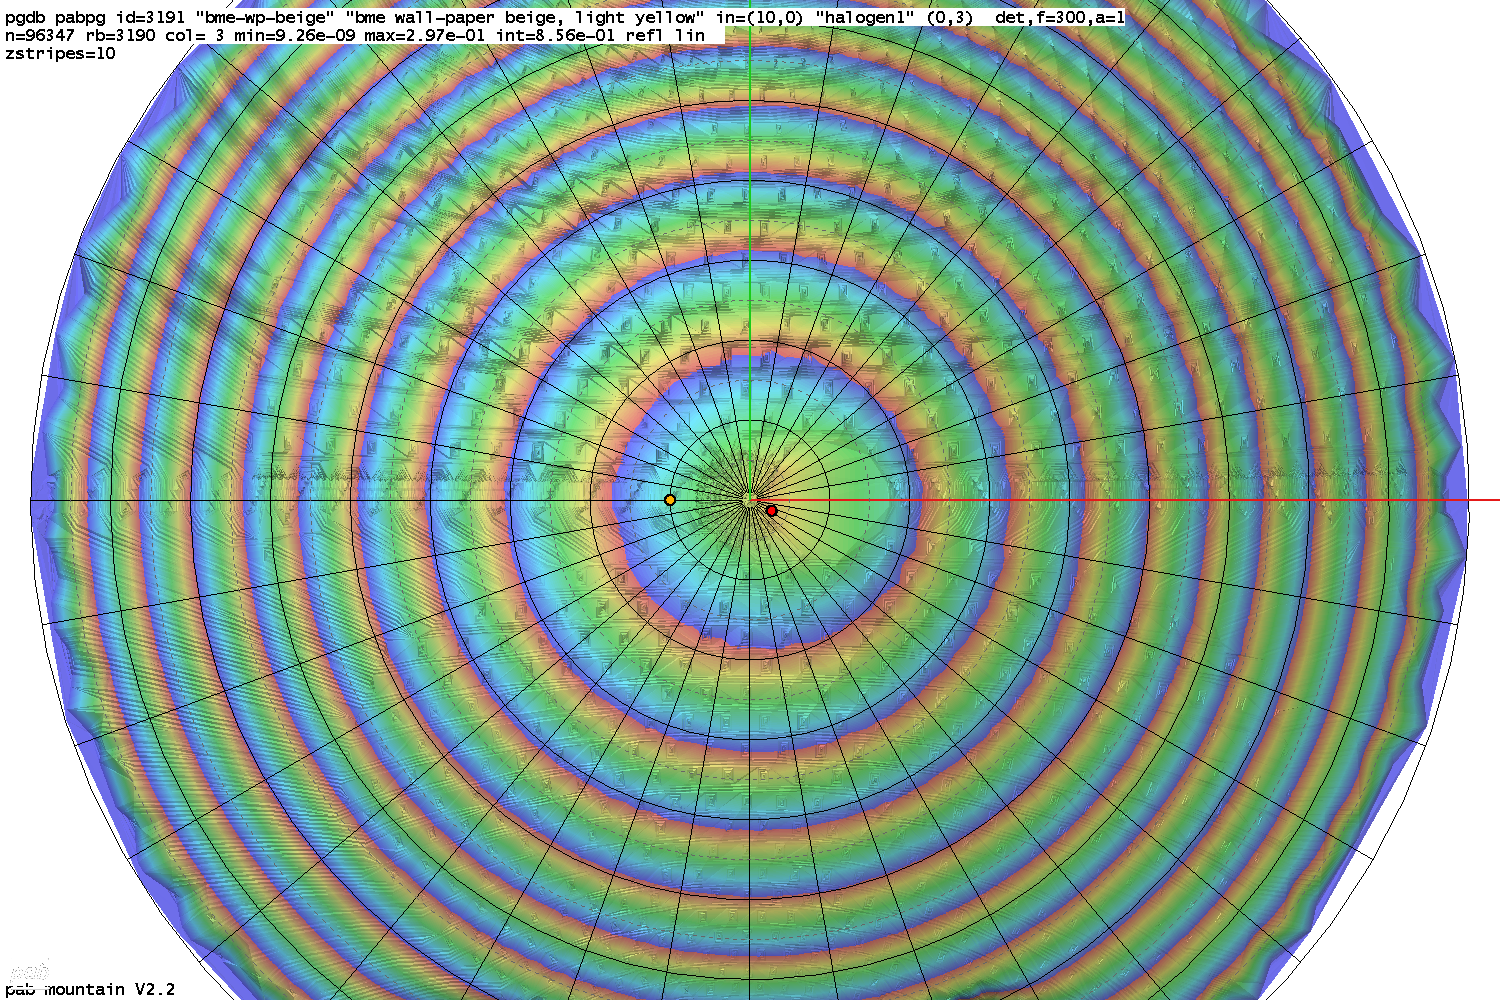
- display of maximum point
- A red dot is displayed at the data-point of maximum value. Mostly used in falsecolored orthogonal plots. (See plot below)
- display of ideal reflected or transmitted peak position
- A yellow dot is displayed at the position of the ideal specular reflective or transmitted peak.
back to gonio-photometer page
web address of this page: http://pab-opto.de?d=/gonio-photometer/mountain-advanced
Datenschutzerklärung , Impressum
page contents © pab
Dr. Peter Apian-Bennewitz,
pab-opto