 |  |
 |  |
 | |
| |
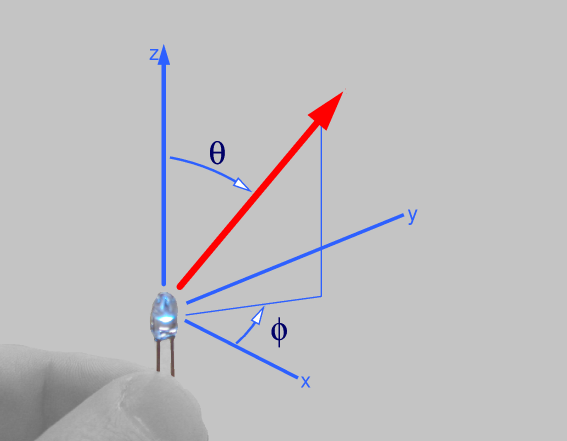
The coordinate system used for self-luminous samples (lamps, LEDs, etc) and for passive reflecting/transmitting samples is basically the same: A standard spherical coordinate system, as shown below.
|
|
For lamps, LEDs and the like, a direction from the sample is given by two angles ϑ, φ, which defines a standard 3D polar, or spherical coordinate system.
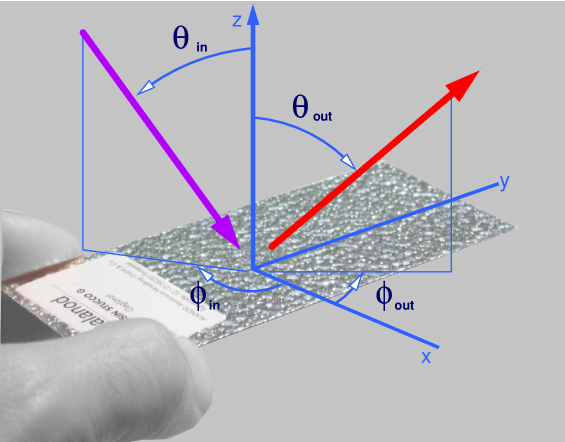
In case of light scattering, the outgoing direction is given by the same two angles: ϑout, φout .
The incident direction is given by ϑin, φin. The X-axis, to which φ is measured, can be selected and
marked on the sample by client.
This coordinate system has been used by us since the first gonio-photometer in 1989 and
is compatible to Standard E2387.
Additionally, we provide data formatted according to client requirements.
For example in the EULUMDAT format for luminescent samples.
Other coordinate systems can be used if material properties are more easily described with these (e.g. materials with symmetries).
The standard data format consists of ASCII text files with lines:
| θ | φ | data |
| 3.93 | 268.72 | 412.422 |
| 3.70 | 268.48 | 490.632 |
| 3.47 | 268.24 | 594.735 |
| 3.25 | 267.99 | 700.952 |
| .... | ... | ... |
Decimal sign is '.' (dot), columns are separated by tabs and line endings are marked with NL-CR. The files should readable by UNIX/Linux
and Windows/Mac programs alike.
Additional parameters (incident angle, time, place, machine of measurement, detector settings, etc) are given as comments in the datafile.
Comment lines start with ASCII symbol # (hash sign).
Custom data formats can be readily supplied (CSV, binary, matrix, etc). Please contact us with your specifications.
With the standard detector, the measured signal is proportional to the incident power on the detector, spectrally weighted by
detector response and optional filters.
With photo-voltaic detectors (e.g. photo-diodes), the units are typically current or, using the characteristics of the detector element, power.
For LEDs, the signal is proportional to the radiant intensity [W/sr] emitted from the LED towards the sensor.
For the BSDF, the signal is then scaled by the incident power onto the sample, resulting in absolute BSDF/BRDF data. Units for the BSDF are
[1/sr], as usual (see ASTM2387).
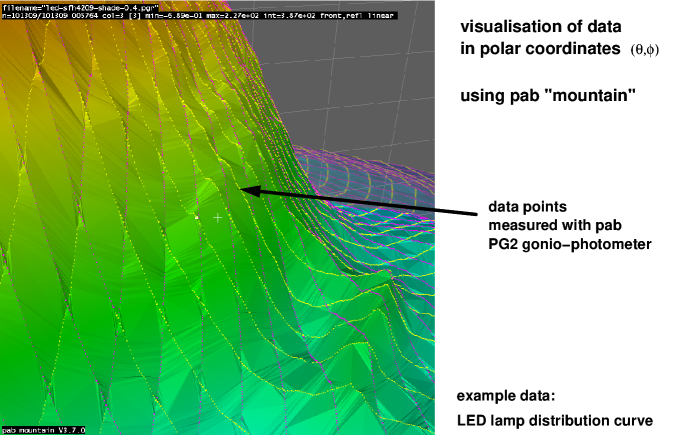
The number of measured points varies between a few thousand and a few hundred thousand points per measurement,
depending on the angular resolution. The number of spectral channels depend on the detector configuration.
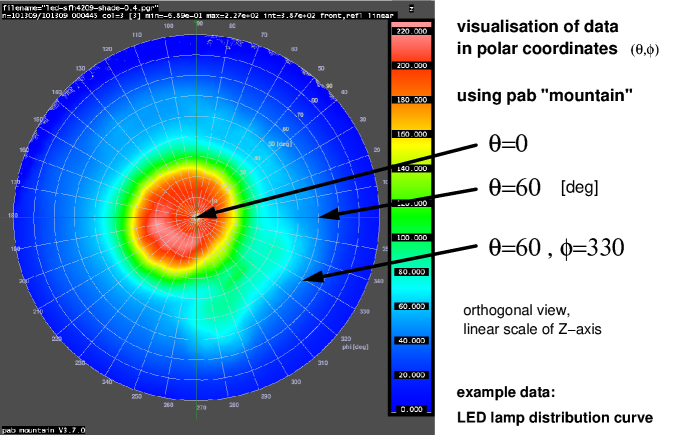
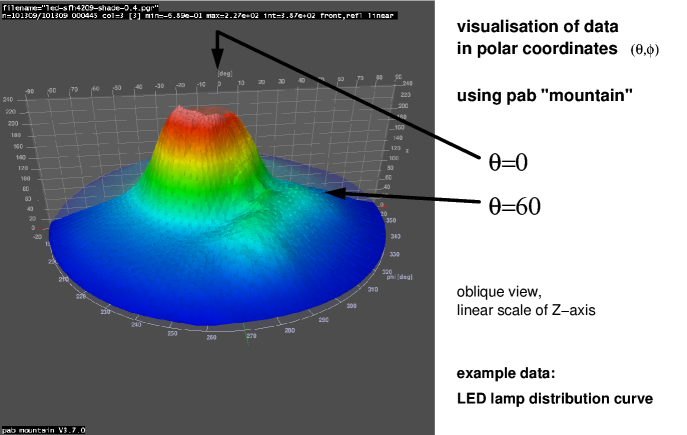
Our proprietary visualisation tools handle complex data effectively and provide a detailed, interactive view of the measured data sets.
They serve to get the maximum information out of measurements and thereby form the essential basis for further analysis of material and lamp
characteristics. By providing the function of a looking glass, they ensure the quality and consistency of our measurements.
Please check part II for advanced mountain settings.
The example below consists of 101309 measured points in the hemisphere.
| ||||
| ||||
|
My "mountain" has a somewhat long history: It began June 17th 1990 as a C-program using IRIS-GL on a SiliconGraphics VGX320.
That version was used to visualize data of my first gonio-photometer, built as a master thesis.
The current version, still written in C, is a complete rewrite that started in 2004, using Open-GL, mostly on Linux 32bit and 64bit.
It is used heavily by me to visualize, check and process BRDF,BSDF data generated by my PG2 gonio-photometer.
The Delaunay triangulation and/or generation of Voronoi-cell was always provided by a library:
The earlier version used a package called "vregion" by Seth Teller, the current one uses "Triangle", which is available free at
http://www.cs.cmu.edu/~quake/triangle.html .
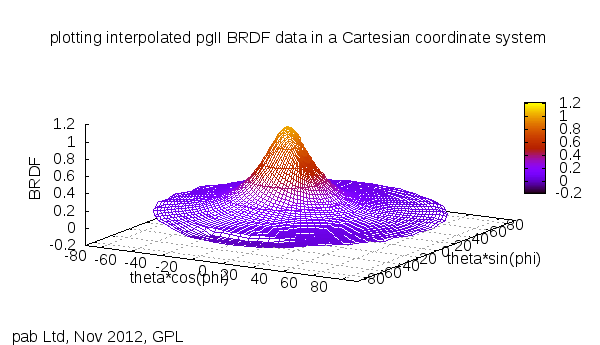
Many plot programs handle data in spherical coordinates with difficulty. Furthermore some programs don't handle scattered data at all, which is data of type z=f(x,y) , with (x,y) not on a regular grid.
Nevertheless, most plot programs can handle BSDF data using workarounds : As an example, here's an input file for
gnuplot:
Gnuplot input and PDF result.
There are two key elements to handle this: First, the BRDF data is interpolated to a regular (ϑ,φ) grid (by us or by you).
Secondly a crude mountain-like plot in a Cartesian coordinate system can be
generated by:
x=ϑcos(φ) , y=ϑsin(φ) , z=BSDF
|
Please find numerous BSDF test data at our sister website.
back to gonio-photometer page
back to demo data page